
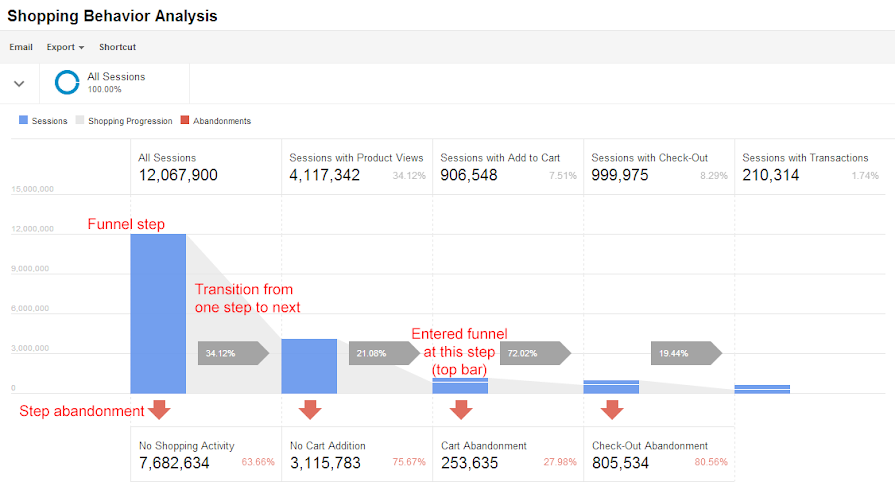
The Shopping Behavior Analysis report lets you see the number of
sessions that included each stage of your purchase funnel, how many
sessions continued from one step to the next, and how many abandoned the
funnel at each stage. Where the funnel indicates abandonment (a red
arrow at the bottom of a step), those users did not complete any
additional steps of the funnel during the same session. Users can
reenter the funnel at any stage (indicated by the separate blue bar at
the top of a step); for example, if a user added something to the cart
during one session, and then came back to complete the purchase in a
subsequent session, the funnel visualization would count the user as
reentering at the Checkout step.
 You can evaluate your users’ shopping experience from product impression to transaction.
Analytics determines the funnel steps based on your tagging. Learn more about tagging your shopping funnel.
You can evaluate your users’ shopping experience from product impression to transaction.
Analytics determines the funnel steps based on your tagging. Learn more about tagging your shopping funnel.
Use the funnel visualization to identify strengths and weaknesses in your purchase funnel. See Evaluate purchase-funnel performance for analysis examples.
In addition to being able to visualize the number of sessions that moved through the funnel, you can use the visualization to create segments of your sessions; for example, the number of sessions that included product views, or the number of sessions that abandoned the funnel at checkout. Simply click a funnel step or abandonment arrow to create a segment. Learn more about creating segments from your funnel.
In addition to the funnel, the table lets you evaluate a number of dimensions and metrics in the context of sessions in general or sessions during which users abandoned the purchase funnel.


0 Comments